Thought leadership13 minute read
The software-defined manufacturer
How moving operating logic from people into software raises margin, throughput and enterprise value
Thought leadership13 minute read
How moving operating logic from people into software raises margin, throughput and enterprise value
A mid-market manufacturer that moves its scheduling, quoting, quality, maintenance and inventory decisions out of spreadsheets and individual memory and into software can plausibly add three percentage points to its EBITDA margin within three to four years and raise its enterprise value by about half. The plant, the workforce and the machines stay as they are. The change is in where the decision logic sits and in who, or what, proposes the first answer.
Four sources account for the gain. Better sequencing lifts output on the existing asset base, which lets revenue grow without new capital. Quotes built from actual routings and cost history expose a job’s margin before the company commits to it. Process data catches drift before parts are scrapped, and condition data schedules repairs before a line stops, removing costs that rarely appear as a line item in the accounts. Replenishment tied to demand lowers inventory and returns cash to the owner.
Buyers also pay a higher multiple for such a business, mainly because its earnings grow larger and easier to forecast. GF Data’s figures for private-equity manufacturing deals show average multiples rising from 5.9 times EBITDA at $10m to $25m of enterprise value to 8.8 times at $100m to $250m. Buyers also mark down companies whose results depend on a few long-serving planners, estimators and supervisors, and a plant whose operating logic is recorded in a system carries less of that risk through diligence and a change of ownership.
For a representative $250m manufacturer, the modelled investment is $8m to $16m over three years. In the base case enterprise value rises by about $97m, including released working capital, from a starting value of about $188m; if pilots never spread beyond a single line, the owner loses about $5m. The eight initiatives in section 6, each with a metric a board can audit, are designed to tell the two outcomes apart early.
In a software-defined plant, scheduling, quality and maintenance logic run in the system, and supervisors spend their time on the exceptions it raises. In most mid-market plants the same logic is held by a few experienced people, and the business moves at the pace their memory and working hours allow.
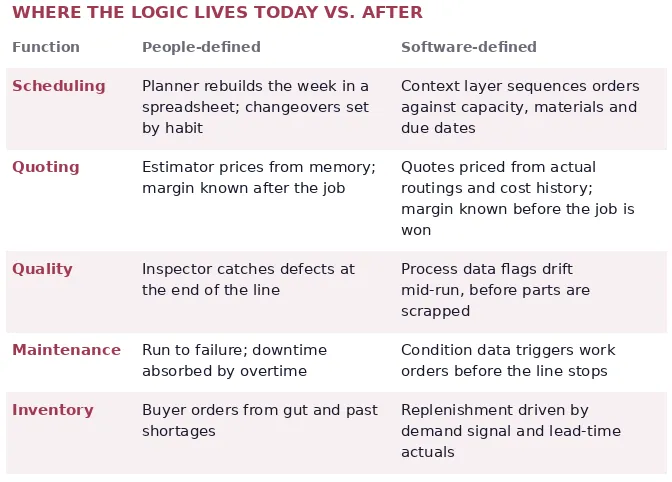
Many plants with current ERP systems still depend on people for their decisions, since the ERP records what has happened while the plan for what should happen is built in a planner’s spreadsheet, an estimator’s head or a supervisor’s morning walk. A software-defined plant uses the system that holds routings, cost history, machine condition and demand to propose the schedule, the price, the maintenance intervention and the purchase order, which people then review and, where necessary, override.
The context layer is the record that makes those proposals trustworthy. A scheduling engine can be no more accurate than the routing times it receives, and a quote inherits the quality of the cost history behind it. A connected record of how a particular plant performs, job by job and machine by machine, accumulates over years and stays with the business when experienced employees leave; competitors have no way to acquire it.
How the programme is justified shapes how it is judged, so the objective should be settled at the start: the same planners, estimators and supervisors running a larger and more profitable business. A programme sold to the board on removing those people books a one-time saving and loses the judgement needed to set the software’s rules and correct its mistakes. The author has called this the Doorman Fallacy, the mistake of treating the removal of cost as the creation of value.
Buyers of mid-market manufacturers price them as a multiple of normalised EBITDA, adjusted for the working capital the business needs, and software that runs plant decisions affects all three terms. Most programmes are justified on EBITDA alone, which understates their effect on value.
Gains in throughput, price realisation, scrap, maintenance cost and expediting reach earnings directly. Boards usually count these, and section 4 sizes them lever by lever.
Private manufacturers lose most ground on the multiple. GF Data, which tracks private-equity deals between $10m and $500m of enterprise value, recorded manufacturing at 6.5 times EBITDA in the first half of 2025, behind healthcare, retail, business services and distribution (Gulfstar Group). Within manufacturing, GF Data’s Q1 2026 figures rise from 5.9 times for $10m to $25m deals to 8.8 times for $100m to $250m deals (Iconic, citing GF Data). Because the size premium is large, growth in EBITDA on the same plant both adds earnings and moves the company into a band where buyers pay more for each dollar of them.
Buyers also discount dependence on individuals. If on-time delivery rests on one planner, margins on one estimator’s memory and uptime on one maintenance lead, a buyer will price in the risk that any of them leaves after closing. Logic held in a system with an audit trail lets the buyer see why the plant performs as it does, which usually means fewer diligence adjustments, less of the price deferred into earn-outs and a narrower spread of bids, even though none of it is recorded as a change in the multiple.
Inventory and receivables tie up cash that would otherwise go to the owner. A lasting reduction in the inventory needed to meet delivery targets frees cash before a sale and lowers the working-capital target a buyer negotiates at closing.
Listed-company data are consistent with this. Damodaran’s regression of EV/EBITDA on company fundamentals across US firms finds multiples rising with expected growth (Damodaran). A plant that adds output without adding machines grows faster for each dollar of capital it spends, and buyers price that capital efficiency when they model free cash flow.
The operating evidence for software-run plants is extensive. Evidence that it changes valuation is indirect and has to be pieced together from deal data and company disclosures, and the sections below keep the two apart.
McKinsey reports that manufacturers using these tools at scale have recorded 30% to 50% less machine downtime, 15% to 30% higher labour productivity, 10% to 30% more throughput and a 10% to 20% lower cost of quality (McKinsey). The World Economic Forum’s Global Lighthouse Network, which recognises plants that have scaled such work, reached 201 sites in September 2025 (WEF). Individual sites map directly onto the five functions in section 1:
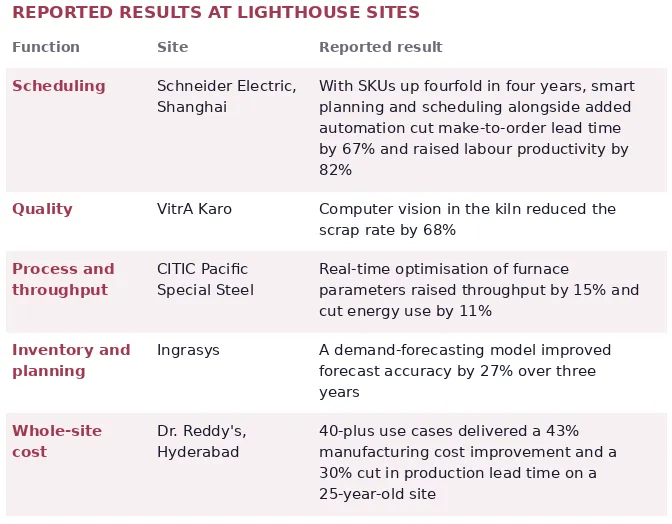
These plants were chosen because they succeeded, and most belong to large companies, so a mid-market manufacturer should expect a fraction of their results. The model in section 8 assumes gains below the bottom of McKinsey’s ranges.
Predictive maintenance attracts the most inflated claims, so the conservative figures deserve preference. Deloitte’s analytics institute estimates that poor maintenance strategies can reduce a plant’s productive capacity by 5% to 20% (Deloitte). The US Department of Energy’s operations and maintenance guide, as summarised by Reliability Magazine, puts predictive maintenance savings at 8% to 12% over preventive programmes and 30% to 40% over reactive ones (Reliamag). The same review notes a McKinsey finding that a 10% false-positive rate erased the savings on one programme, which is an argument for applying condition monitoring to constraint assets first.
Among listed companies, the clearest evidence that codified decision rules raise margins comes from Illinois Tool Works, whose 80/20 system is a management discipline with no particular software attached. ITW has run its enterprise strategy since 2012 and credits it with steady gains in margins and returns (ITW 2024 annual report). In its fourth quarter of 2025 ITW reported a record operating margin of 26.5%, with enterprise initiatives contributing 140 basis points, and it guides to roughly another 100 basis points in 2026 that management describes as largely independent of volume (Yahoo Finance). The 80/20 system decides centrally which customers, products and processes deserve resources; software allows a mid-market firm to make comparable decisions for each job, machine and order as they arise.
Most programmes do not reach the whole plant. McKinsey’s surveys found the share of manufacturers stuck in a pilot trap rose from 70% in 2017 to 74% in late 2020 (McKinsey), and that only about 30% of pilots reached scale (McKinsey). The usual cause is a pilot built on data that exists only for one line, which cannot be extended because the plant has no common record of routings, costs and machine states, which is the reason section 5 starts with the context layer.
Each function affects enterprise value through a different part of the valuation. The largest effect, and the one boards tend to count last, is additional output from the existing plant that the company is able to sell.
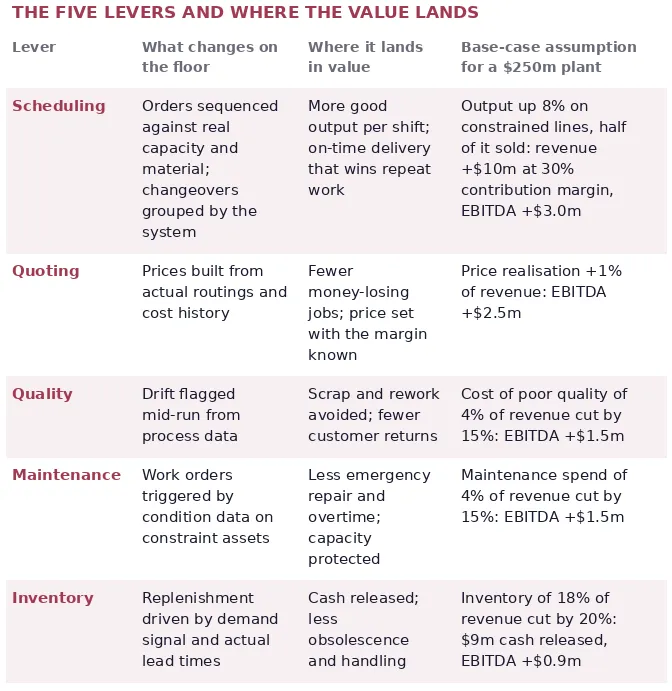
All assumptions in the right-hand column are the author’s modelled estimates for a representative plant, set deliberately below the published ranges in section 3.
Scheduling carries the largest gain because it adds capacity. A plant scheduled from a spreadsheet loses output to badly sequenced changeovers, to material shortages discovered at the machine and to expediting that disrupts the rest of the week. Recovering a few points of capacity at the constraint allows the company to accept work it now turns away, without new equipment or hires. The model credits only half of that capacity, since the gain becomes value only if sales can fill it.
Quoting is often overlooked. In make-to-order businesses a job is priced before anyone knows what it will cost, and the estimator’s memory is the only link between the two numbers. Quotes that draw on actual run times, scrap rates and material costs for similar parts show which bids carry too little margin and where the company can price aggressively on parts it makes well. The benefit shows up in the margin mix, and it compounds, because each completed job adds to the cost history behind the next quote.
Quality and maintenance protect the capacity that scheduling recovers. A part rejected at final inspection has already used machine time, material and labour, whereas drift caught mid-run costs a handful of parts. An unexpected failure on a constraint machine disrupts the whole schedule, and the overtime spent recovering is booked as labour, so it seldom appears in the maintenance budget.
Buyers who order from memory of the last shortage carry buffers against problems the plant may already have solved. When replenishment follows current demand and actual supplier lead times, inventory can fall without harming delivery, and the released cash is available to the owner.
Three conditions decide the outcome: data the plant can trust, a first lever placed at the constraint, and ownership of the new system by the people who hold the logic today.
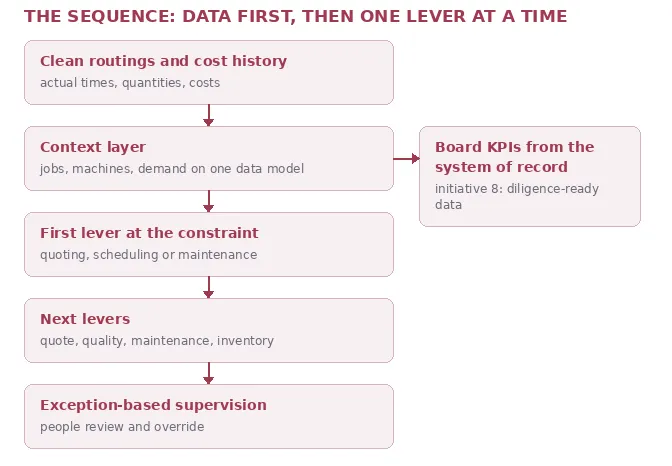
The context layer feeds every lever and the board’s reporting; the levers are added one at a time, each on the same data.
The work starts with routings and cost history. In most mid-market ERP systems the standard run times are years out of date, labour is booked to jobs in bulk at the end of a shift and scrap is recorded, if at all, as a monthly adjustment. A scheduling engine fed those numbers will produce a confident but wrong schedule, and the planner will return to the spreadsheet within a month. The first six months of a programme should go on capturing actual times, quantities and costs at the job and machine level, from machine signals where possible and from simple operator entry elsewhere.
A single context layer should follow. Routings, job history, machine condition, quality readings, inventory and open demand need to share identifiers so that each lever draws on the same record. Five separate point tools, one per function, reproduce the spreadsheet problem behind better screens, with each tool holding part of the record and people reconciling them by hand.
The first lever belongs at the constraint. For a job shop with long quote cycles and thin margins that usually means quoting; for a plant that is sold out and late, scheduling; for a process plant with an unreliable bottleneck asset, condition-based maintenance on that asset. Showing results at the constraint within nine to twelve months funds the later levers and earns credibility on the floor.
The planner, estimator and maintenance lead know the plant’s exceptions better than any vendor, and they should own the system. They set the rules it applies, review its proposals and keep the override log. Their work moves from producing schedules, quotes and work orders to supervising the system that produces them, and their judgement becomes part of the company’s records.
The programme also needs a small permanent team. For a $250m manufacturer that typically means a product owner drawn from operations, two or three data and integration engineers and an analyst for each lever, responsible for keeping data clean and rules current. Programmes run wholly by an outside implementer tend to decay after the implementer leaves.
Connecting machines to business systems opens network paths that did not previously exist, so segmentation between office and plant networks, a device inventory and patching belong in the budget from the start.
A CEO should run eight initiatives, each with a named owner and a metric drawn from the system of record and reviewed by the board each quarter. The targets are the author’s suggested benchmarks for a $250m discrete or make-to-order manufacturer; each company should set its own baseline in the first 90 days and calibrate from there.
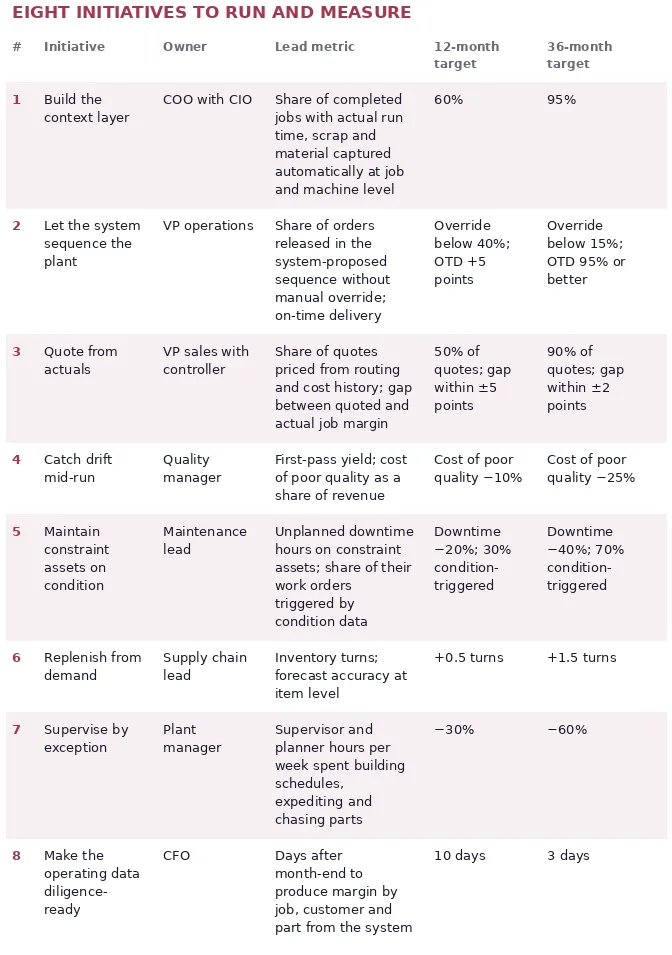
Initiative 1 underpins the rest: without automated capture of actual times and costs, initiatives 2 to 6 run on assumptions and the plant drifts back to spreadsheets. Initiative 7 shows whether the change has taken hold, because supervisors who still spend their mornings building the day are treating the software as advice, and the value will be a fraction of the model. Initiative 8 produces the evidence a buyer will examine.
The board should agree a stopping rule at the outset. If by month 12 fewer than 40% of jobs carry automatically captured actuals and the first lever has not moved its metric, the company should pause further levers and fix the data before spending more, which limits the loss if the foundation proves weaker than expected.
A $250m manufacturer should plan on $8m to $16m over three years, or roughly 1% to 2% of revenue a year. These are modelled estimates built from the stated assumptions; each line should be re-priced against the company’s own vendor quotes, ERP condition and payroll.
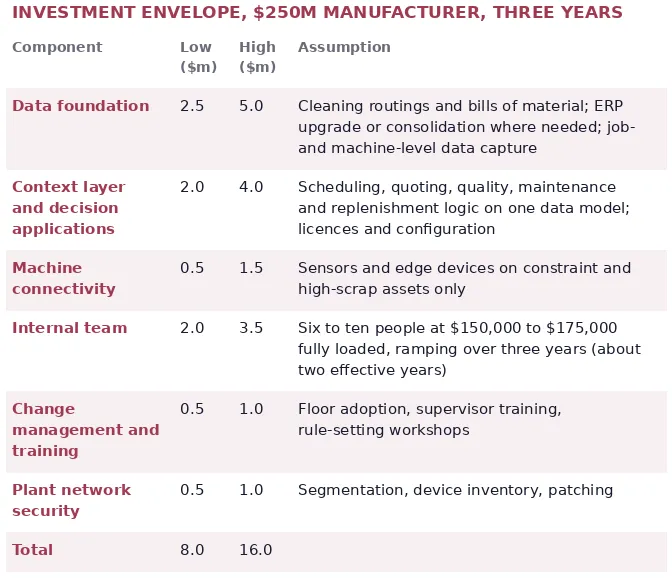
Spending is front-loaded. About 40% goes out before the first lever produces measurable savings, because the data foundation comes first. The internal team then becomes a permanent operating cost of roughly $1m to $1.75m a year, and a CFO who treats the envelope as a one-off project will understate the run rate. The largest budget risk is the ERP: a plant on an unsupported or heavily customised system may need to replace it, adding several million dollars and a year.
For comparison, a plant that stops after the data foundation and a single lever would spend about $4m to $7m. That is a reasonable first commitment for an owner who wants proof before funding the rest, provided the lever is chosen at the constraint.
In the base case a $12m programme adds about $97m of enterprise value and released cash by year four, roughly eight times the investment. Close to three-quarters of that comes from added EBITDA valued at the company’s existing multiple, so the case holds even if buyers grant no re-rating.
Assumptions (modelled). Revenue $250m; EBITDA margin 10% ($25m); valuation 7.5 times EBITDA, giving a starting enterprise value of $187.5m. The 7.5 times sits between GF Data’s 5.9 times for $10m to $25m manufacturing deals and 8.8 times for $100m to $250m deals. Inventory is 18% of revenue ($45m). Programme cost is the $12m midpoint of section 7. Lever gains are those in section 4 for the base case.
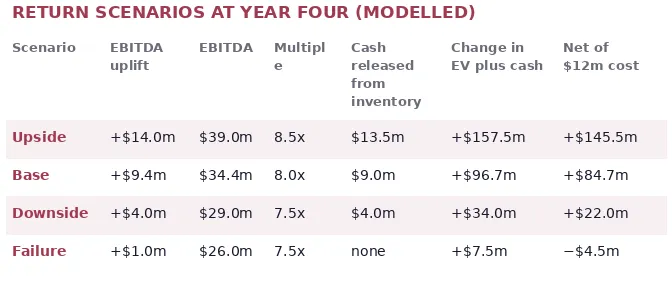
In the base case the $9.4m of added EBITDA, valued at the starting 7.5 times, accounts for $70.5m. Half a turn of additional multiple on the enlarged EBITDA adds $17.2m, which the model attributes to larger, more predictable earnings and reduced dependence on individuals. The $9m of released inventory is cash.
The half-turn is the least certain of the three terms. It is small beside the roughly three-turn spread GF Data shows between the smallest and larger manufacturing deals, and without it the base case still produces about $80m, nearly seven times the investment, so an owner sceptical that buyers pay for reduced key-person risk can leave it out and still fund the programme.
Payback is quick for an industrial investment. Once scheduling or quoting is live at the constraint, typically within the first year, the plant should be earning $3m to $5m a year of added EBITDA against cumulative spending of $5m to $7m, and on cash alone the base case pays back in the second year after the first lever goes live.
A company that spends the full envelope and never moves beyond pilots loses a few million dollars and a year of management attention, a smaller downside than most capital decisions a manufacturer takes. A board that applies the month-12 stopping rule caps it further.
A private-equity owner can complete this plan within one holding period, since the returns arrive as EBITDA and cash within about two years.
The data foundation should start within a sponsor’s first 100 days, since every later lever depends on it. Initiative 8 turns operating claims into data a buyer’s diligence team can test, narrowing the gap between the seller’s adjusted EBITDA and the buyer’s own estimate. A platform company with a working context layer can also move each add-on acquisition onto its routings, costing and scheduling logic within months, which makes buy-and-build synergies more credible and quicker to realise.
Owners with no plans to sell receive the same benefits: less exposure to the retirement of their most experienced people, room to grow without new plant, and cash released from inventory. A buyer’s valuation is one way of pricing those gains, and a founder planning succession has as much reason to track it as a sponsor planning an exit.
Figures in sections 4, 6, 7 and 8 are modelled estimates or suggested targets built on the stated assumptions. Other figures come from the sources below, accessed September 2026.
• McKinsey, Preparing for the next normal via digital manufacturing’s scaling potential
• McKinsey, How manufacturing’s Lighthouses are capturing the full value of AI
• McKinsey, Industry 4.0 adoption with the right focus
• McKinsey, The last IT/OT mile and pilot purgatory
• World Economic Forum, Global Lighthouse Network, September 2025
• Schneider Electric, Shanghai and Monterrey Lighthouses, October 2024
• Dr. Reddy’s, Hyderabad Lighthouse, October 2022
• Deloitte Analytics Institute, Predictive Maintenance position paper
• Reliability Magazine, Predictive maintenance ROI benchmarks
• Illinois Tool Works, 2024 annual report
• Yahoo Finance, ITW Q4 2025 earnings call coverage
• Gulfstar Group, Middle market commentary, first half 2025 (GF Data sector multiples)
• Iconic, Manufacturing EBITDA multiples (GF Data Q1 2026 manufacturing figures)
Tell us what is holding your operations together. thinkbridge will show you what it looks like built right.